The tuner & demodulator charts provide a visual representation of various properties of the received broadcast signal. An example of the chart is:
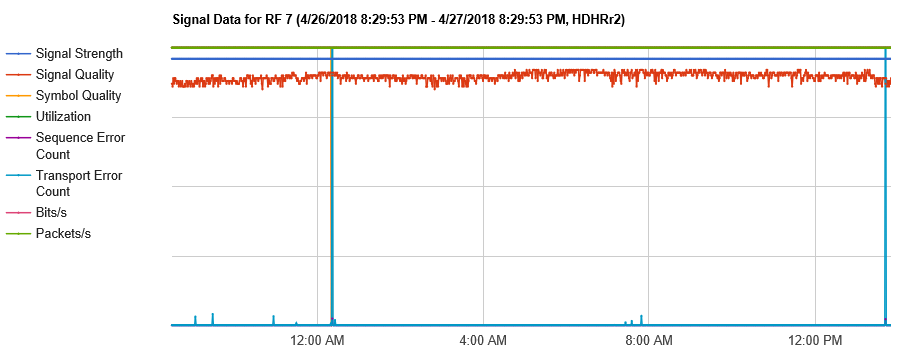
The following are obtained from the tuner / demodulator (and as reported by the HDHomerun). The values are queried from the HDHomerun once per minute and can be considered instantaneous values at the time of sampling. Please also see this page in the HDHomerun forums for further discussion of signal strength, signal quality, and symbol quality.
- Signal strength. This is a value between 0 – 100 representing the strength of the received signal.
- Signal quality. This is a value between 0 – 100 representing how clearly defined the signal is. It can be thought of as similar to SNR, however SiliconDust does not specifically state how this metric is derived and it may be a mix of various metrics and/or vary across HDHomerun models.
- Symbol quality. This is a value between 0 – 100 representing the percentage of error-free data received over the last second. The error-free count includes errors corrected via Reed-Solomon coding.
- Raw bits/s. The raw channel bits/s. For ATSC 1.0 this is nominally 19.39 Mbit/s.
Because the signal strength, signal quality, and symbol quality can vary by the HDHomerun device model, the model used to collect the data is displayed in the chart title after the date range. In the example chart displayed above, the tuner and demodulator statistics originated from a first generation, second revision HDHomerun (HDHRr2). In the event that multiple models contributed data (i.e. due to a reconfiguration of the monitoring system), then multiple models may be shown.
The following are obtained by analyzing the demodulated and captured transport stream. The values are logged once per minute and represent the cumulative amount (in the case of transport or sequence errors), or the average (in the case of utilization) over the one minute period.
- Transport error count. This is a count of the number of packets where the TEI bit is set.
- Sequence error count. This is a count of the number of times the continuity counter incremented unexpectedly across all streams in the MPTS.
- Utilization. This is a ratio of: (total number of packets in MPTS) / (total number of packets in MPTS – number of NULL packets in MPTS)
- Signal loss. This is a count of the number of seconds during which no transport stream packets were received from the HDHomerun. While the likely cause of this event is loss of signal, it is also possible that a signal was present (i.e. tuner lock was acquired) but carried no data, or that the demodulator failed to lock onto the ATSC data framing.