The Program & Bitrate charts plot the bitrate for each program in an MPTS. The program bitrate is the aggregate bitrate of each stream PID in the program’s PMT, averaged over ten minutes. Non-stream PIDs, for example dedicated PCR PIDs, are not included in the bitrate. The bitrate of the program’s PMT PID itself is likewise not counted towards the program’s bitrate.
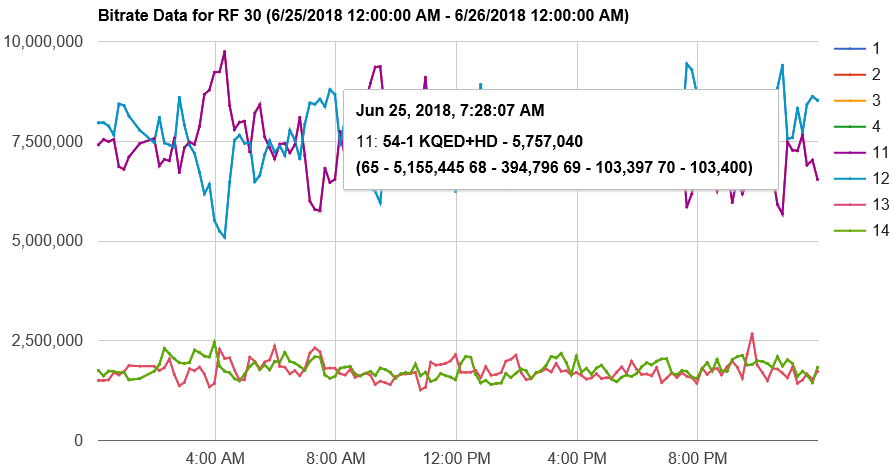
Detailed information can be displayed by hovering over a data point. This includes:
- The channel’s virtual channel number and short name, as obtained from the most recent TVCT when the data point was generated. This may be absent if PSIP information was not available when the data point was generated.
- The bitrate for each of the program’s stream PIDs.
In some cases the same set of PIDs may be advertised as multiple programs. This is illustrated in the chart above, where program 11 (54-1 KQED+HD) is identical to program 2 (9-2 KQED+HD). While lines for both programs are drawn, one will be obscured by the other. Hovering over a program in the legend will highlight its line and assist in determining which programs are aliases of each other.
The aggregate bitrate of all programs will generally not add up to the MPTS bitrate (~19.39 Mbit/s for ATSC 1.0) because:
- The bitrate for PSI/PSIP tables are not included.
- The bitrate for the NULL PID (0x1FFF) is not included.
- PIDs may be present that are not included in any program. In order to be plotted, a PID must be part of a program advertised in the MPTS’s PAT.
- Some PIDs may be included in multiple programs.